Foodborne Illness Data Analysis
Used R to analyze data regarding foodborne illnesses to look into their major sources.

About Project
This team-based project conducted a data analysis of foodborne illnesses and their causes in the United States. Publicly available data was used in the project and R Studio was used to perform the data analysis.
Foodborne illnesses are very prevalent in today's world because of their wide reach. With this in mind, the team working on this project took steps to find data that could help us try to answer questions such as: Which food groups cause the most foodborne illnesses? Which sources do most foodborne illnesses come from? To try and answer questions such as this, our team took steps to research major foodborne illnesses, such as salmonella, which taking the time to find relevant data regarding foodborne illnesses from reputable sources such as the World Health Organization.
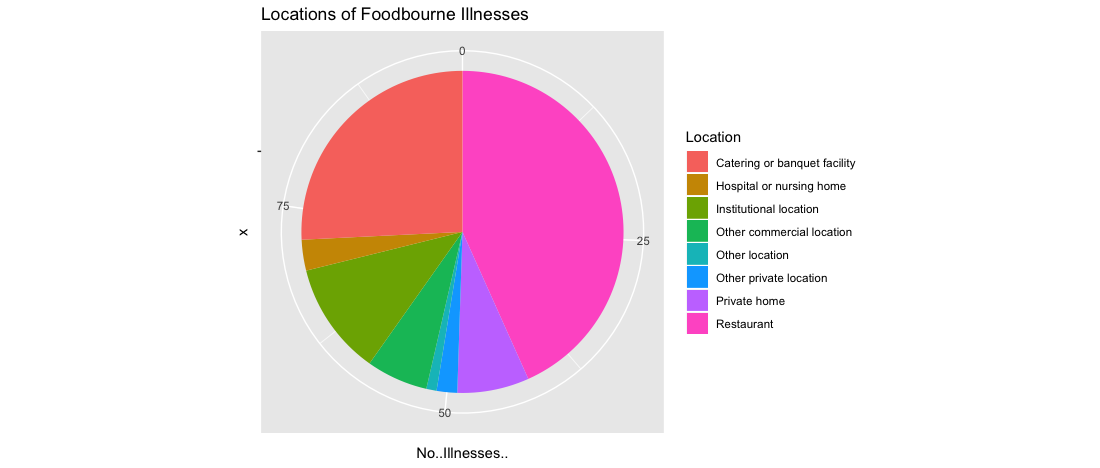
After collecting relevant data, our team used R Studio and R Scripting methods to analyze our data. This involved the making of a variety of graphs, plots, and more, which allowed us to see trends in our data. With this, we compiled a variety of results. For instance, it seems that restaurants are the biggest cause of foodborne illnesses. Additionally, we looked into the specific causes of foodborne illnesses in New York City restaurants, finding that mice were often found in food preparation and storage areas which oftentimes were not properly cleaned, to begin with.
A graph detailing the origins of foodborne illnesses:
In addition to compiling and analyzing data, our team also created a report detailing our process and collected results, which can be found here.